Link to Part 2: Laying the Cluster Foundation
Disclaimer: This is not production guidance and it is not sponsored. It documents what actually ran in my homelab with Arc GPUs and k3s. Please double-check before you roll it into your own setup.
Table of Contents Link to heading
- Table of Contents
- 00 Reflecting on a year of learning
- 01 The Stack at a Glance
- 02 Packaging and Storage
- 03 GPU Allocation
- 04 Application Layer
- 05 Monitoring and Observability
- Conclusion
Some personal notes follow below. If you want to skip them, scroll to the next section or use the table of contents.
00 Reflecting on a year of learning Link to heading
I ordered the first Intel Arc A770 almost exactly a year ago on September 17, 2024, and told myself I’ll learn how AI works on Kubernetes, because I’ve spent the money on the hardware anyway. I have to confess the build did gather dust for a few months due to life/work, but I did manage in roughly a year to achieve 3 key goals:
- Stable inference MVP. Intel Arc GPUs run reliably inside Kubernetes.
- My own OpenAI-compatible API on a budget. Two GPUs cost about €600 in total. I don’t pay tokens or cloud credits. It’s slower and less convenient than cloud.
- Transferable knowledge. I stayed with open standards and open source so I can apply the same ideas elsewhere.
In this regard, I’m most grateful for the experience I gained with Kubernetes in general, FluxCD, the new concept of Dynamic Resource Allocation and packaging models with KitOps.
Not a lot, is it?
Well, everything seemed intimidating at first as it was very unfamiliar. I especially remember the first times reading docs or articles on the topic of LLMs and I didn’t understand more than 80% of the content. Terms like FP8, BF16, KV cache, context length, 8B/13B/70B param, VRAM, quantization 4-bit/8-bit, LoRA/QLoRA. Getting familiar with Python environments, dealing with Intel’s extension for PyTorch before XPU support got merged upstream. A lot of hours reading GitHub issues, because documentation was often and still is very much lagging behind or missing on the issues I was facing. Intel’s CEO switches and company restructuring don’t help the ecosystem either, and it was felt while trying to make all this work. But I digress…
I’m happy I now have a platform I can upgrade and develop on top of, while somewhat understanding it on a more fundamental level.
01 The Stack at a Glance Link to heading
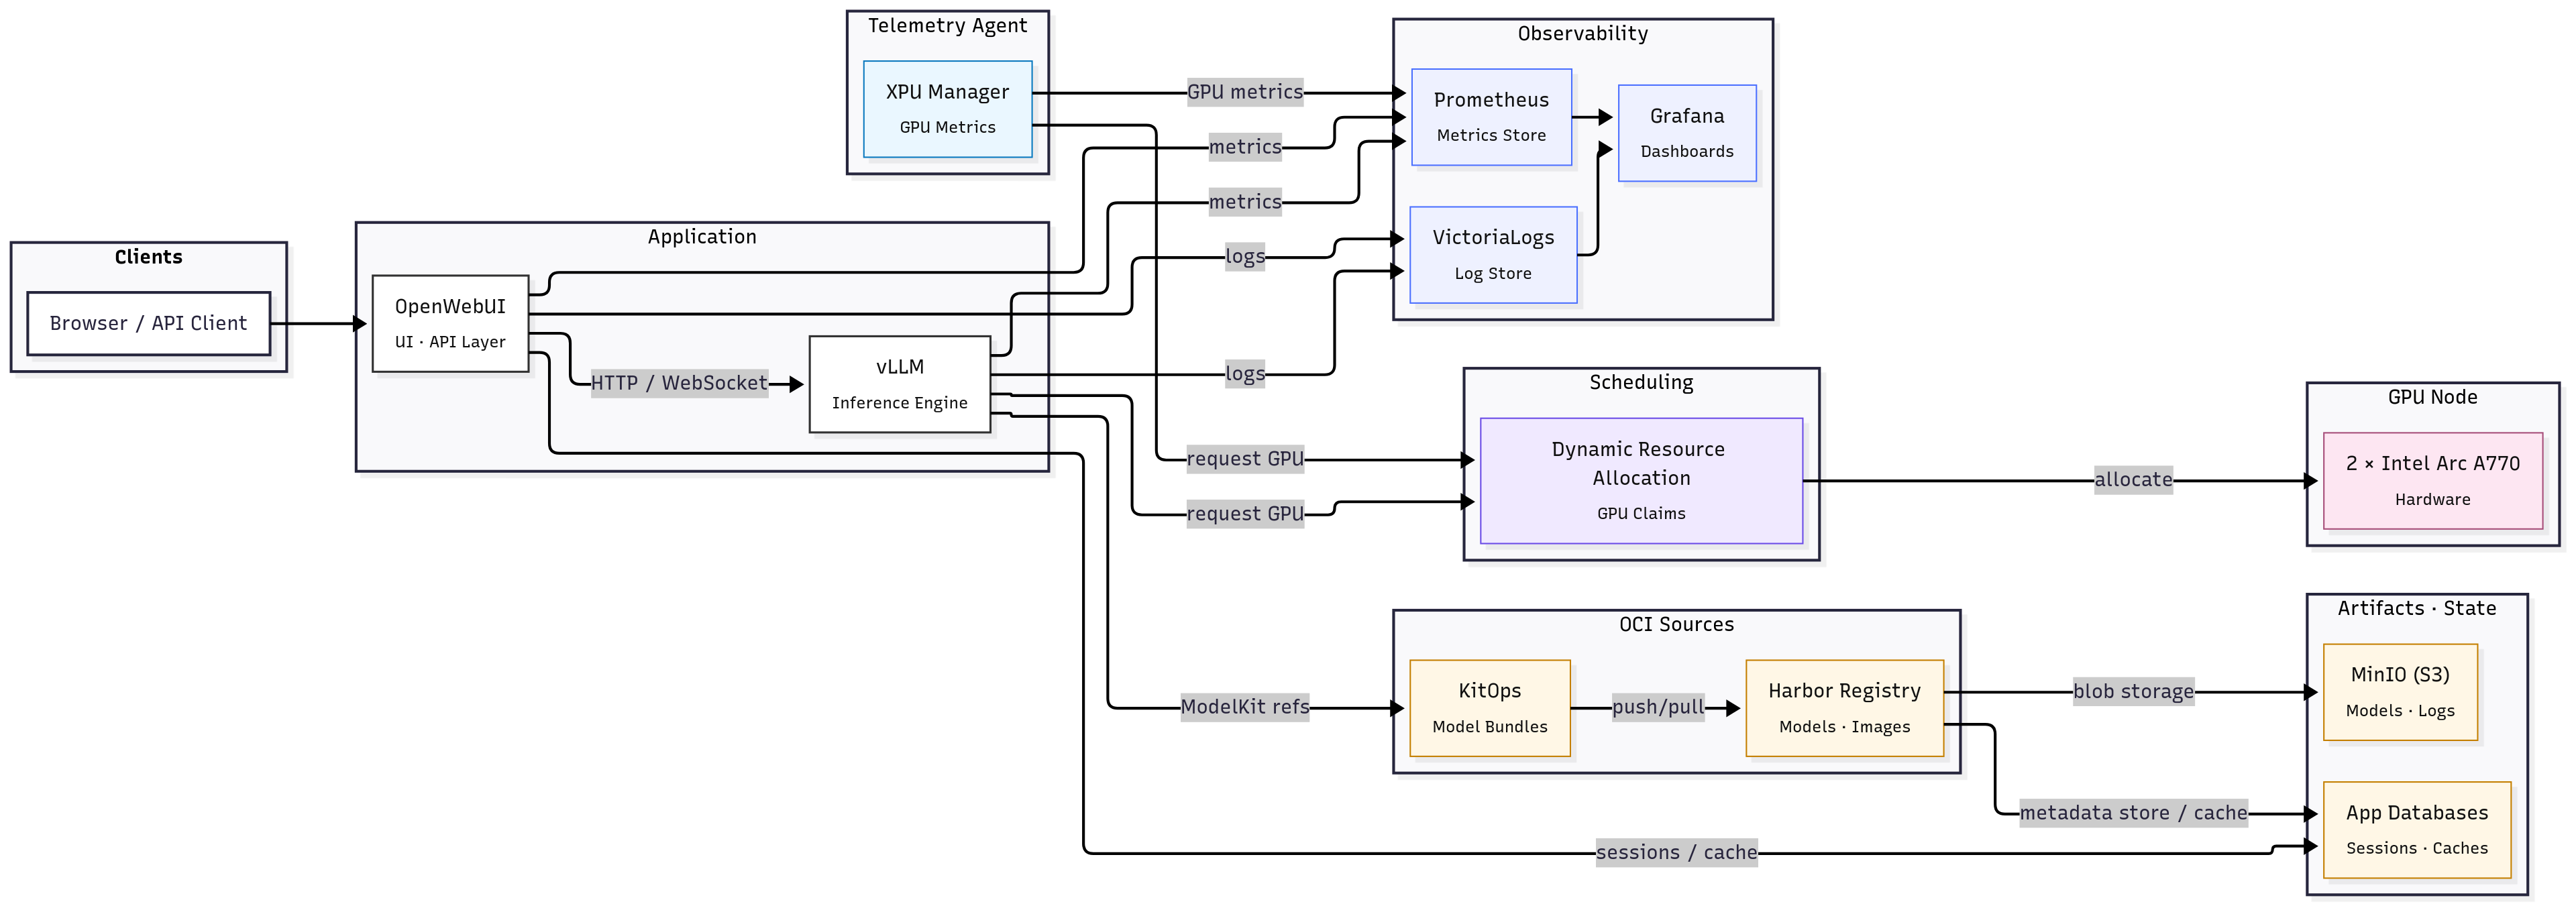
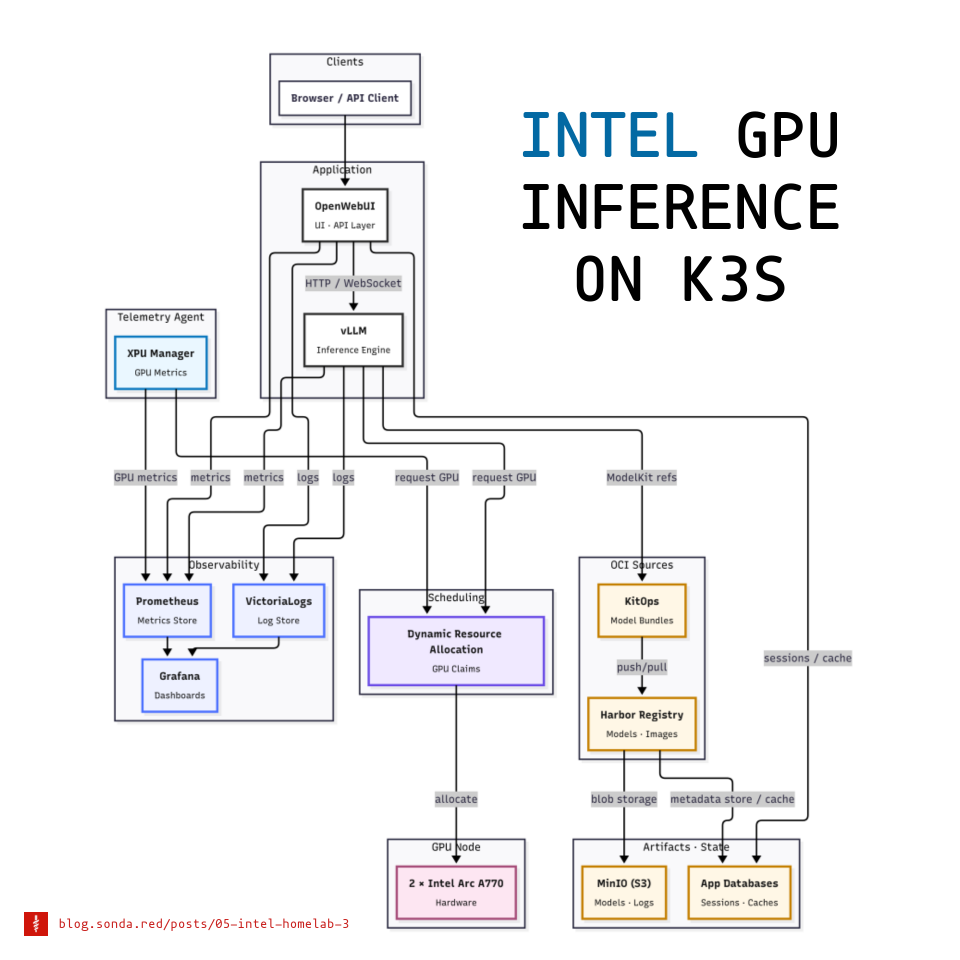
Users hit OpenWebUI. OpenWebUI talks to vLLM which serves an OpenAI-compatible API. Models are packaged with KitOps and stored in Harbor with blobs in MinIO. vLLM starts with KitOps as a sidecar and pulls weights from Harbor. GPU access uses Dynamic Resource Allocation (DRA) and Intel resource drivers. Prometheus and VictoriaLogs leverage the services and xpumanager to feed Grafana so I can see metrics and logs in one place.
I’ve named this article “MVP” because this is not a production-ready stack. But it’s stable, working, and I can iterate on it. You’ll see below in the notes where I describe the challenges how a lot of times a small part of the stack was not working as expected and broke balance.
The three main pillars of the stack are:
- Packaging and Storage
- GPU Allocation
- Monitoring and Observability
These 3 allow the application layer to run reliably. I will cover each in turn below.
02 Packaging and Storage Link to heading
This really is the backbone of the stack. If you can’t get models to the workloads reliably, the rest falls apart. When we’re dealing with small Docker containers, pulling a few hundred MBs from Docker Hub is no big deal.
Imagine baking in the 122GB DeepSeek-R1-Distill-Qwen-32B model into a container image and you had a typo in the Dockerfile. Are you going to rebuild it? How long will it take? How much space will it take on your registry? What if you want to try a different model? Do you bake it in again?
Let’s download it from HuggingFace into a volume then? That’s the solution, right? You’d have to architect a solution not only for reliable pulling but for versioning that handles exact dataset, code, hyperparameters, etc. You need to roll back or run on small differences between models. What’s the best practice for that?
Aim Link to heading
- Version models and move them between workloads without surprises.
- Keep I/O paths short so large pulls and unpacks don’t stall pods.
Stack Link to heading
- MinIO (S3) - as a Helm release on the GPU node
- Harbor (OCI registry) - as a Helm release on the GPU node
- KitOps (ModelKits) - as a sidecar in vLLM workloads
- Postgres and Redis for app state - as Helm releases on NUC nodes
Actions I took Link to heading
- Gave MinIO a large PV on the GPU node.
- Set Harbor to use S3 as backend.
Both of these steps are described in more detail in the previous post.
- Pinned Harbor to the GPU node with node affinity to avoid cross-node traffic.
- Pushed models as KitOps ModelKits to Harbor and referenced them from vLLM.
Supplying models to workloads Link to heading
I already had some models downloaded locally from my local tests:
- DeepSeek-R1-Distill-Llama-8B
- DeepSeek-R1-Distill-Qwen-14B
- DeepSeek-R1-Distill-Qwen-1.5B
- DeepSeek-R1-Distill-Qwen-32B
- DeepSeek-R1-Distill-Qwen-7B
- Llama-2-13b-chat-hf
- Llama-2-13b-hf
- Llama-2-7b-chat-hf
- Llama-3.1-8B-Instruct
- Llama-3.2-3B-Instruct
In a local Docker environment, I would just mount a volume and point the model loader to it.
docker-compose.yaml
services:
  llm-serving:
    image: intelanalytics/ipex-llm-inference-cpp-xpu:latest
    container_name: ilx
    network_mode: host
    deploy:
      resources:
        limits:
          memory: 48G
    shm_size: 32G
    environment:
      - MODEL_PATH=/llm/models
      - USE_XETLA=OFF
      - SYCL_PI_LEVEL_ZERO_USE_IMMEDIATE_COMMANDLISTS=1
      - SYCL_CACHE_PERSISTENT=1
      - ONEAPI_DEVICE_SELECTOR=level_zero:*
    volumes:
      - /data/llm/models:/llm/models
      - /data/llm/models/ollama:/root/.ollama/models
    devices:
      - "/dev/dri/renderD129:/dev/dri/renderD129"
      - "/dev/dri/renderD130:/dev/dri/renderD130"
    stdin_open: true
    tty: true
  webui:
    image: ghcr.io/open-webui/open-webui:main
    container_name: webui
    network_mode: host
    volumes:
      - /data/llm/webui:/app/backend/data
In Kubernetes, I could always mount a host path to a volume and call it a day. However, this is a dirty, wasteful, and unsustainable solution, not at all applicable to workloads at scale. I found KitOps which packages models as OCI images (ModelKits) and can push/pull them from any OCI registry (Harbor in my case). It’s not the only thing it does; be sure to explore it in their docs. In short, it helps if:
- You have multiple models / datasets being developed in parallel.
- Experimentation to production hand-offs are a pain: “but which dataset?”, “which model version?”, “what code was used?"
- You care about audit/compliance or want tighter security.
- You already use container registries, CI/CD pipelines, Kubernetes etc., so you can integrate without too much new infra.
The initContainer kitops-init pulls the ModelKit image, unpacks it to a volume, and vLLM will serve the model from there later. We’ll see that in action here. Now let’s see how to package our model:
Before creating a fully automated pipeline, I manually packaged a model with KitOps CLI:
kit login harbor.sonda.red.local
# If we didn't already download the model, we can import it from HuggingFace
kit import https://huggingface.co/deepseek-ai/DeepSeek-R1-Distill-Llama-14B
# Otherwise, init a kitfile in the model directory and you'll be prompted for metadata
cd DeepSeek-R1-Distill-Llama-14B
kit init .
cat Kitfile
manifestVersion: 1.0.0
package:
  name: ds-r1-qwen-14b
  description: DeepSeek-R1-Distill-Qwen-14B
  authors: [Kalin Daskalov]
model:
  path: model-00001-of-000004.safetensors
  license: MIT
  parts:
    - path: model-00002-of-000004.safetensors
    - path: model-00003-of-000004.safetensors
    - path: model-00004-of-000004.safetensors
    - path: config.json
    - path: generation_config.json
    - path: model.safetensors.index.json
    - path: tokenizer.json
    - path: tokenizer_config.json
code:
  - path: .
docs:
  - path: LICENSE
    description: License file
  - path: README.md
    description: Readme file
# Pack a modelkit with a specific kitfile and tag
kit pack . -t harbor.sonda.red.local/sonda-red/ds-r1-qwen-14b:0.0.1
kit push harbor.sonda.red.local/sonda-red/ds-r1-qwen-14b:0.0.1
That’s it. The model is now in Harbor and can be referenced from workloads. I repeated this for all models I wanted to use. And if I wanted to change something, I just updated the Kitfile and repack/push. You’d push only the diffs, not the whole blob again.
kit list

REPOSITORY                                             TAG      MAINTAINER       NAME              SIZE        DIGEST
harbor.sonda.red.local/sonda-red/ds-r1-llama-8         0.0.1    Kalin Daskalov   ds-r1-llama-8     29.9 GiB    sha256:1aed2ade6511630754d79589b10475cb5b92e9f96cf241c182fc2c1c7f88ba7f
harbor.sonda.red.local/sonda-red/ds-r1-qwen-1.5b       0.0.1    Kalin Daskalov   ds-r1-qwen-1.5b   6.6 GiB     sha256:6ee43ee48bb1e72032a89dc0c876cf04c2438756e4495e1f9ab4ca498763bc36
harbor.sonda.red.local/sonda-red/ds-r1-qwen-14b        0.0.1    Kalin Daskalov   ds-r1-qwen-14b    55.0 GiB    sha256:7a75e2eaef06858408a4572af7cf31ee9464c39bd92781fe27afcf8de2ac3d96
harbor.sonda.red.local/sonda-red/ds-r1-qwen-32b        0.0.1    Kalin Daskalov   ds-r1-qwen-32b    122.0 GiB   sha256:0147c9694a513a4c38e7ec000a50aeb9cf16a59568a1d2e75f1201dd28b7e953
harbor.sonda.red.local/sonda-red/llama-3.1-8b          0.0.1    Kalin Daskalov   llama-3.1-8b      59.8 GiB    sha256:6dbbab498985a21f95728219a1dbbec7ff76e7190107badffc9ae8766ce71552
Challenges Link to heading
Network considerations Link to heading
- In my case, the ingress controller load balancer service has a MetalLB VIP. If pods or hosts resolve harbor.sonda.red.local to the MetalLB VIP, traffic leaves the node and comes back. Big blobs transfer at very low speeds because my GPU node is far from the router and NUC master and worker node. I connect it to the same network via WiFi, but it’s still a bottleneck.
- If you’re hosting your own object storage, registry, and GPU workloads, try to keep them on the same node or ensure nodes have a fast path between them.
- Leveraging Cilium’s topology-aware routing helps keep traffic local.
- Your ingress controller (NGINX in my case) may have body size limits and timeouts that choke big pushes/pulls.
metadata:
  annotations:
    nginx.ingress.kubernetes.io/proxy-body-size: "4g"
    nginx.ingress.kubernetes.io/proxy-read-timeout: "600"
    nginx.ingress.kubernetes.io/proxy-send-timeout: "600"
- Runners executing pull/push pipelines also need to be positioned well to maximize throughput.
- Of course, storage hardware and filesystem matter too. I use a fast NVMe SSD on the GPU node.
03 GPU Allocation Link to heading
I thought I had it all figured out with the classic Intel device operator and GPU plugin that I described in my previous post, but I ran into issues when trying to run tensor parallel workloads.
When researching for an alternative, I found the rather new Kubernetes Dynamic Resource Allocation (DRA) API that acts similarly to dynamic volume provisioning, in which you use PersistentVolumeClaims to claim storage capacity from storage classes and request the claimed capacity in your Pods.
I decided to give DRA a try as it seemed to fix what I kept struggling with.
Aim Link to heading
- Make Intel GPUs discoverable and claimable by workloads.
- Claim multiple GPUs for one workload.
- Make multiple workloads share the same GPU claim.
Stack Link to heading
- k3s 1.33 / 1.34
- Dynamic Resource Allocation (References as DRA below)
- Intel resource drivers (gpu.intel.com)
- containerd with CDI enabled
Actions I took Link to heading
- Enabled DRA and CDI in k3s and containerd.
- Installed the Intel resource driver DaemonSet.
- Created ResourceClass and ResourceClaimTemplate objects.
- Requested claims from vLLM workloads.
What DRA is Link to heading
DRA lets pods request vendor devices through first-class APIs instead of opaque resourceName counters. It introduces DeviceClass, ResourceClaim or ResourceClaimTemplate, and ResourceSlice. A DRA driver advertises devices and uses CDI to inject them into pods.
In regards to vanilla Kubernetes, DRA reached v1 and was enabled by default in version 1.34. However, I was running k3s v1.33.4+k3s1, which was the latest stable release at the time. A few issues I hit:
- k3s
1.33.4+k3s1did not have DRA enabled by default - Intel resource drivers templates are all
v1beta1and the API group was not served by default in k3s1.33.4+k3s1 - Playing around with feature gates and runtime config flags was needed to get DRA working, but mixing up API versions and feature gates caused confusion, because in 1.33 the API version is
v1beta2. - Took the risk and upgraded to k3s
1.34.1-rc+k3s1pre-release, which didn’t enable the feature gate by default either, but at least the API group was served by default and I could usev1resources.
Feature gates in Kubernetes are a way to enable or disable experimental or optional features. In this case, the feature gate DynamicResourceAllocation needs to be enabled for DRA to work. In k3s, you can pass feature gates to the kube-apiserver, kube-controller-manager, kube-scheduler, and kubelet components via the k3s config file.
/etc/rancher/k3s/config.yaml
kube-apiserver-arg:
  - feature-gates=DynamicResourceAllocation=true
kube-controller-manager-arg:
  - feature-gates=DynamicResourceAllocation=true
kube-scheduler-arg:
  - feature-gates=DynamicResourceAllocation=true
kubelet-arg:
  - feature-gates=DynamicResourceAllocation=true
To enable the resource.k8s.io/v1beta1 API group in k3s 1.33, you can use the --runtime-config flag for the kube-apiserver. This flag allows you to enable or disable specific API groups and versions.
/etc/rancher/k3s/config.yaml
...
kube-apiserver-arg:
  - runtime-config=resource.k8s.io/v1beta1=true
Enable CDI in containerd Link to heading
k3s uses containerd as its only built-in container runtime, running it as an integrated lightweight service with simplified defaults and patches, whereas vanilla Kubernetes leaves containerd (or another CRI runtime) as a separately installed and managed component. Configuring containerd in k3s is done via the k3s config file, but you need to create a custom config.toml file for containerd itself, especially on the node where the Intel resource driver DaemonSet will run (the GPU node). In contrast, the feature gate for DRA is set in the k3s config file on the master node.
Intel resource driver docs have a section in their docs describing on how to enable CDI in containerd. The difference in k3s is that instead of editing /etc/containerd/config.toml directly, you edit the config file used by k3s to generate containerd’s config and then restart k3s:
/var/lib/rancher/k3s/agent/etc/containerd/config.toml
[plugins."io.containerd.grpc.v1.cri"]
  enable_cdi = true
  cdi_spec_dirs = ["/etc/cdi", "/var/run/cdi"]
Intel resource driver DaemonSet Link to heading
From here on, installing the Intel resource driver is rather straightforward and their docs are clear. You have options to use NFD or not; I chose not to. The DaemonSet will run only on the GPU node with a nodeSelector. You can install the raw manifests or use Helm. I chose Helm and discarded all traces of the Intel device operator and GPU plugin.
Verification that the DaemonSet is running and devices are advertised:
kubectl api-resources --api-group=resource.k8s.io
NAME                     SHORTNAMES   APIVERSION           NAMESPACED   KIND
deviceclasses                         resource.k8s.io/v1   false        DeviceClass
resourceclaims                        resource.k8s.io/v1   true         ResourceClaim
resourceclaimtemplates                resource.k8s.io/v1   true         ResourceClaimTemplate
resourceslices                        resource.k8s.io/v1   false        ResourceSlice

kubectl get deviceclasses
NAME            AGE
gpu.intel.com   6d20h

kubectl get resourceslices -A
NAME                             NODE         DRIVER          POOL         AGE
sonda-core-gpu.intel.com-z2z9z   sonda-core   gpu.intel.com   sonda-core   5d17h
From the output above, you can see that the gpu.intel.com DeviceClass is registered and the sonda-core node (my GPU node) has a ResourceSlice with Intel GPUs. Two of the resources are namespaced (ResourceClaim and ResourceClaimTemplate) because they are requested by pods, while DeviceClass and ResourceSlice are cluster-wide.
Since the workloads will be concentrated mostly in the vllm namespace, I created the ResourceClaimTemplates there (deployments/vllm/resource-claim-templates.yaml).
deployments/vllm/resource-claim-templates.yaml
# Dual GPU claim template for tensor parallel workloads (TP=2)
apiVersion: resource.k8s.io/v1
kind: ResourceClaimTemplate
metadata:
  name: dual-gpu-claim
  namespace: vllm
spec:
  spec:
    devices:
      requests:
      - name: gpu
        exactly:
          allocationMode: ExactCount
          count: 2
          selectors:
            - cel:
                expression: 'device.attributes["gpu.intel.com"].model == "A770"'
          deviceClassName: gpu.intel.com
---
# Single GPU claim template for single GPU workloads (TP=1)
apiVersion: resource.k8s.io/v1
kind: ResourceClaimTemplate
metadata:
  name: single-gpu-claim
  namespace: vllm
spec:
  spec:
    devices:
      requests:
      - name: gpu
        exactly:
          allocationMode: ExactCount
          count: 1
          selectors:
            - cel:
                expression: 'device.attributes["gpu.intel.com"].model == "A770"'
          deviceClassName: gpu.intel.com
Due to my CPU being the Intel i9-12900K with integrated Intel UHD 770 graphics, it also appears as an available GPU device. To avoid workloads being scheduled on the iGPU, I used a CEL expression to filter only discrete GPUs (A770 in my case). CEL is a simple expression language that can be used in Kubernetes for various purposes, including filtering devices based on their attributes.
Exploring your ResourceSlice with kubectl describe can help you identify the exact model names of your GPUs, as well as attributes like memory size, vendor, etc. You can then use these attributes in your CEL expressions to filter devices according to your requirements.
Challenges Link to heading
If you’re still on the classic Intel device plugin (shares) Link to heading
With the Intel device GPU plugin we had this particular setup:
# Number of containers that can share the same GPU device (default: 1)
# Higher values allow more workloads to share GPU resources
- "-shared-dev-num"
- "10"
# Enable '*_monitoring' resource that provides access to all Intel GPU devices on the node
# Useful for metrics collection with tools like XPU Manager or Prometheus
- "-enable-monitoring"
# GPU allocation policy for shared-dev-num > 1 (default: none)
# Options: balanced (spreads workloads), packed (fills one GPU first), none (first available)
- "-allocation-policy"
- "balanced"
More info on the flags: [https://intel.github.io/intel-device-plugins-for-kubernetes/cmd/gpu_plugin/README.html#modes-and-configuration-options]
With this setup, the cluster has two A770 GPUs and each GPU is split into 10 shares, so the total capacity is gpu.intel.com/i915: 20 and gpu.intel.com/i915_monitoring is 2 (one per physical GPU). When you create an example pod with 1 share requested:
apiVersion: v1
kind: Pod
metadata:
    name: gpu-test
spec:
    containers:
    - name: gpu-test
      image: intel/xe-llm-inference-cpp-xpu:latest
      resources:
        limits:
          gpu.intel.com/i915: 1
Everything works fine. You see the GPU from within the pod and your inference app works. However, if we change the limits to gpu.intel.com/i915: 2, things break.
Why?
The GPU plugin doesn’t guarantee two shares will land on two different physical GPUs. They can land on the same physical GPU and the inference app (vLLM in my case) will try to initialize two devices, but only one device file is mounted in the pod.
Official docs say that you should set --shared-dev-num=1 in the plugin if you want workloads to use the whole GPU:
Intel GPU-plugin supports a few different operation modes. Depending on the workloads the cluster is running, some modes make more sense than others. Below is a table that explains the differences between the modes and suggests workload types for each mode. Mode selection applies to the whole GPU plugin deployment, so it is a cluster wide decision.
| Mode | Sharing | Intended workloads | Suitable for time critical workloads |
|---|---|---|---|
| shared-dev-num == 1 | No, 1 container per GPU | Workloads using all GPU capacity, e.g. AI training | Yes |
| shared-dev-num > 1 | Yes, >1 containers per GPU | (Batch) workloads using only part of GPU resources, e.g. inference, media transcode/analytics, or CPU bound GPU workloads | No |
This way, you can request gpu.intel.com/i915: 2 and be sure that two physical GPUs will be allocated. However this scenario depletes the available GPU resources and now only one pod has access to them.
DRA solves this problem by allowing you to claim multiple physical GPUs for one workload and also share them between workloads. You can have two pods sharing the same GPU, but each pod can request two physical GPUs for tensor parallel workloads.
On a node with 2 GPUs, here’s what each approach can (and cannot) do:
| Scenario | Intel Device Plugin | DRA (Dynamic Resource Allocation) |
|---|---|---|
| 1. One pod → one GPU | ✅ Works (shared-dev-num=1 or >1) |
✅ Use a single-GPU ResourceClaim |
| 2. One pod → multiple GPUs | ⚠️ Only reliable with shared-dev-num=1; with shares, -allocation-policy (balanced/packed/none) influences placement but doesn’t guarantee distinct GPUs |
✅ Either attach two single-GPU claims or one claim with count: 2 |
| 3. Multiple pods → one GPU | ✅ With shared-dev-num > 1 (share-level, weak isolation) |
✅ Reuse the same claim across pods (intentional sharing); separate claims = isolation |
| 4. Multiple pods → multiple GPUs | ⚠️ Spread depends on share placement; still opaque | ✅ Explicit: per-pod claims (isolated) or shared claims (intentional sharing) |
The plugin’s
-allocation-policyonly steers share placement; DRA gives claim-level guarantees.
Conclusion: Link to heading
The Intel plugin forces you into a cluster-wide choice between exclusivity or sharing, while DRA lets you mix and match all four scenarios safely within the same cluster.
04 Application Layer Link to heading
Where it all comes together.
This part of the stack is relatively straightforward as it basically provides the user-facing API and web UI. The challenges faced in the previous steps trickled down from here, as vLLM and OpenWebUI work as intended and all issues were tied to the underlying infrastructure layers.
Aim Link to heading
- Serve an OpenAI-compatible API.
- Host a web UI to interact with the models.
Stack Link to heading
-
vLLM for the OpenAI-compatible API
-
OpenWebUI for the web interface
Linked manifests:
Actions I took Link to heading
- Deployed OpenWebUI with Helm, Postgres, and Redis.
- Deployed vLLM with KitOps and DRA claims.
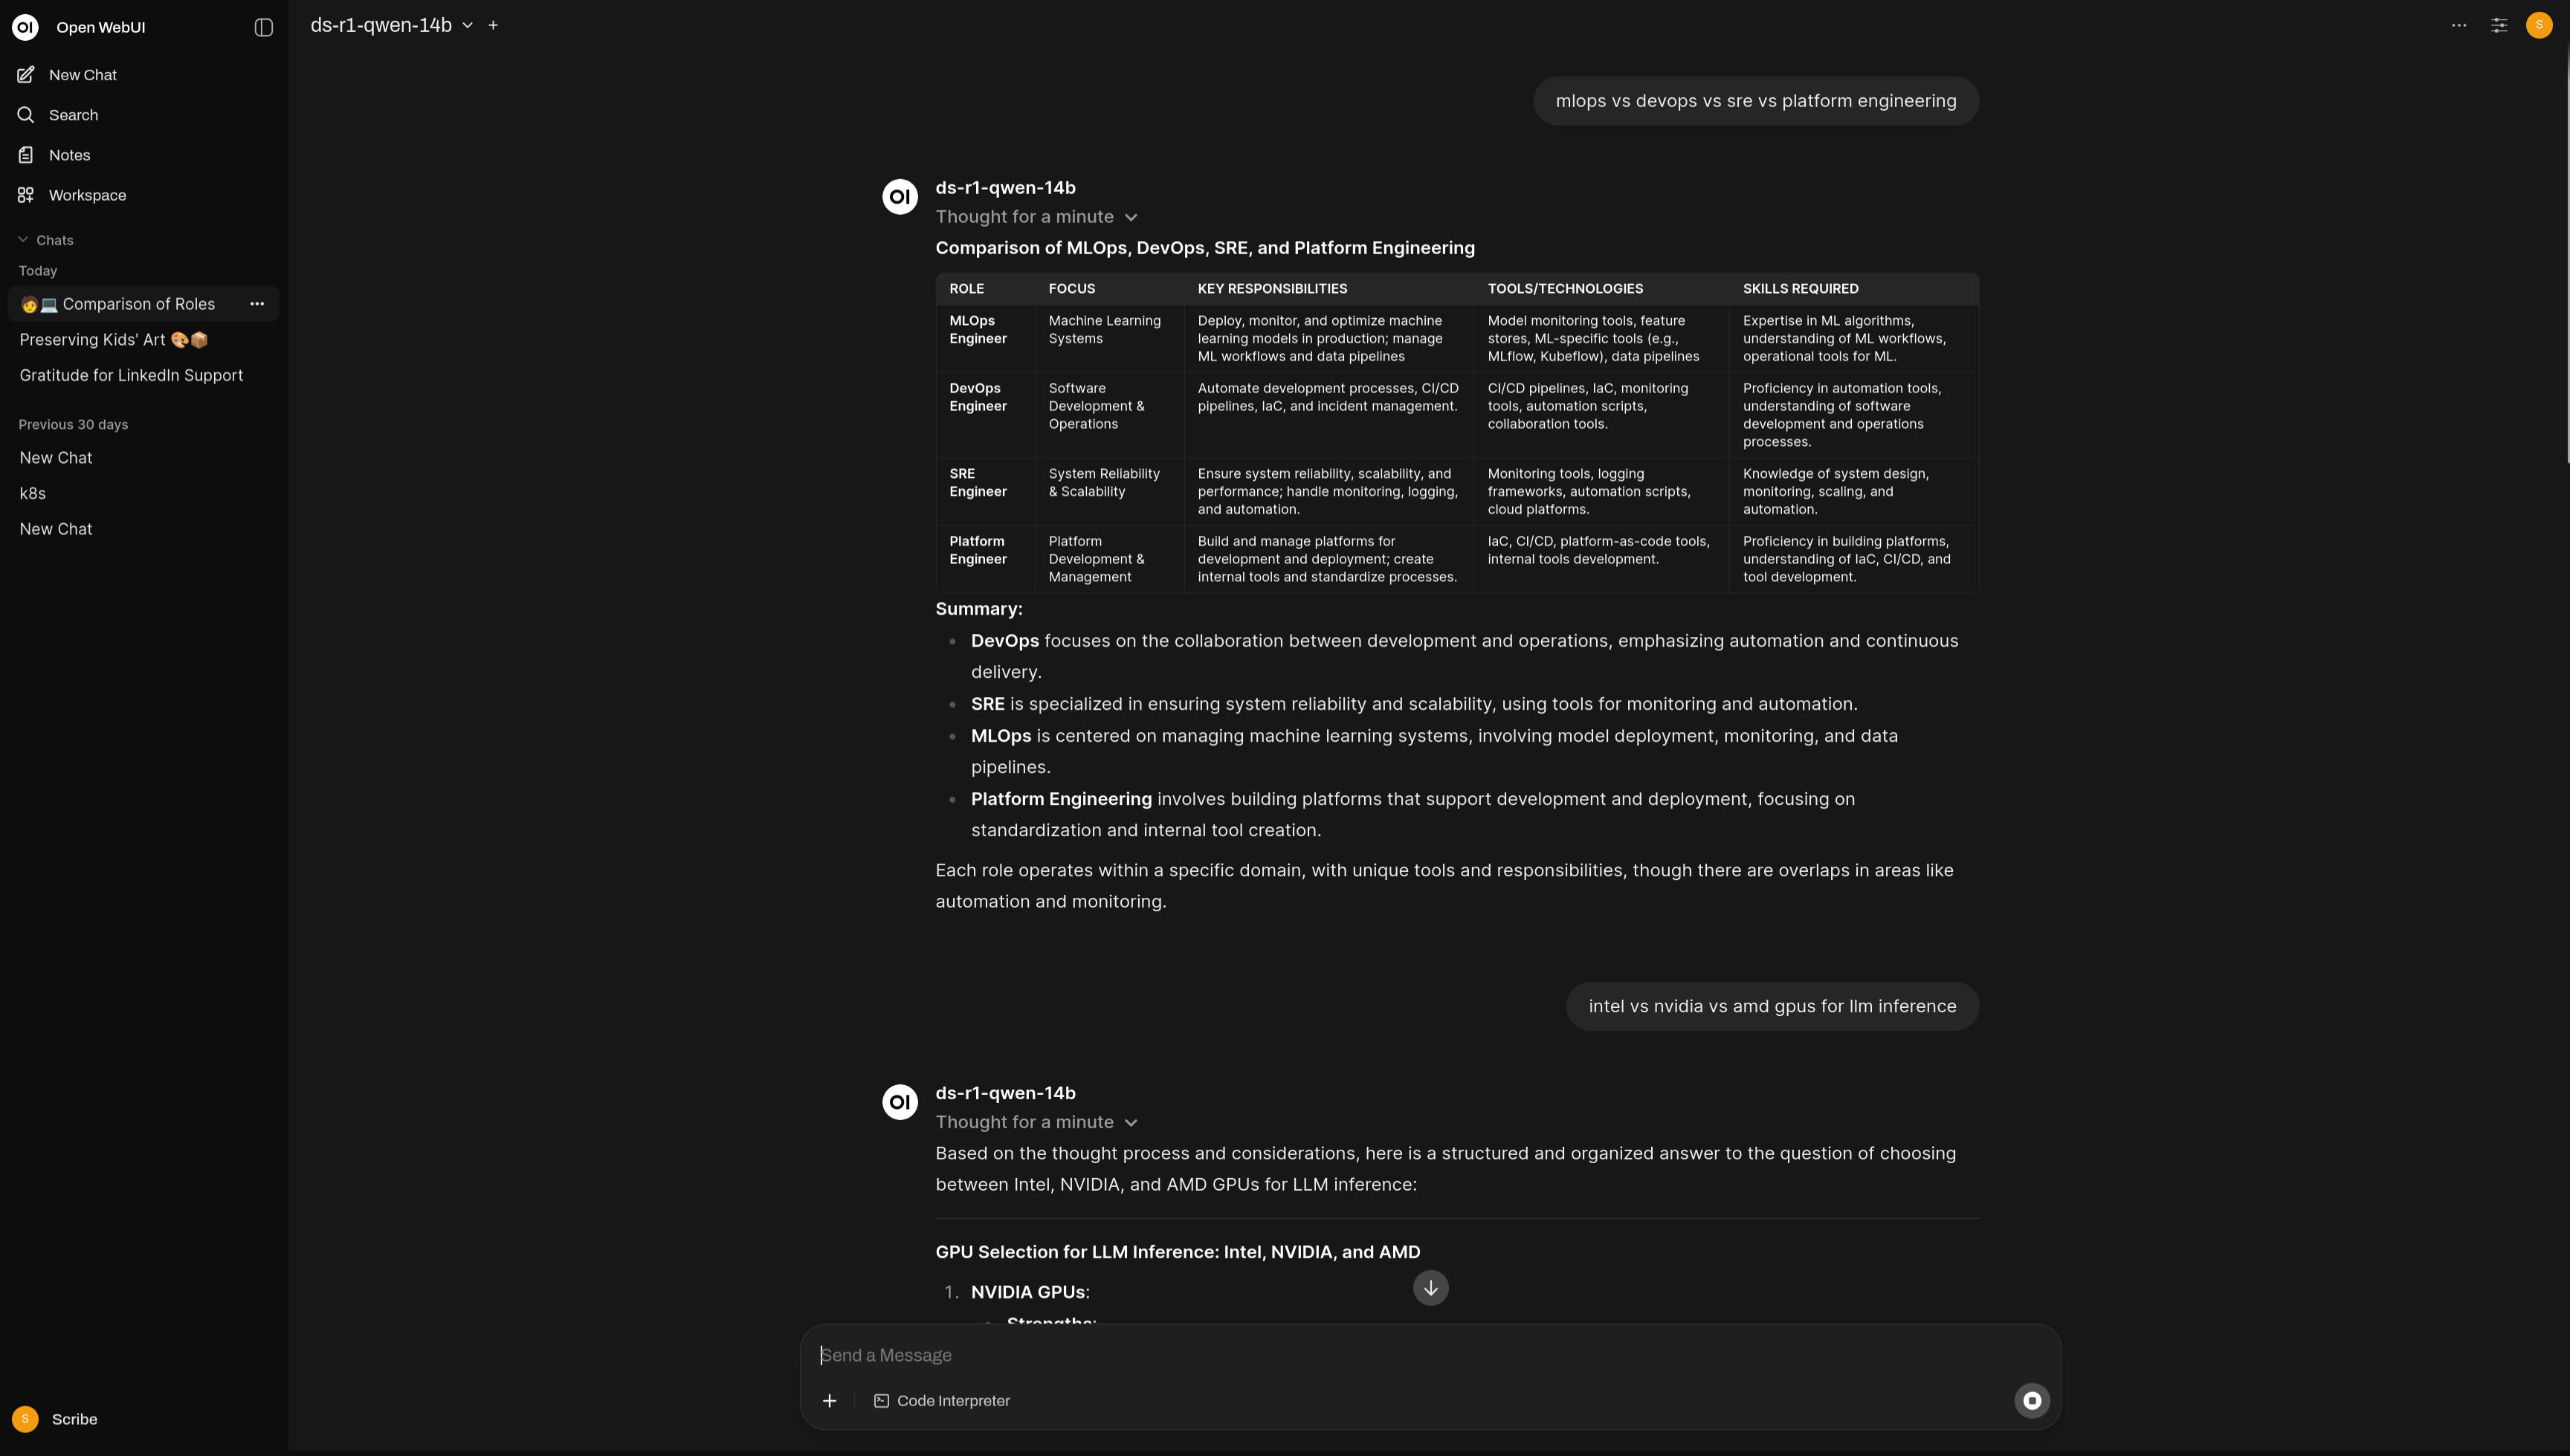
OpenWebUI Link to heading
OpenWebUI is a web interface for LLMs that supports multiple backends, including vLLM. It has user management, chat history, and other features. Basically your own ChatGPT interface. I deployed it with Helm and used Postgres for sessions/history and Redis for WebSockets/cache.
vLLM with KitOps ModelKit and DRA claims Link to heading
Why vLLM?
Not much to say here. Locally, I’ve tried several options like ollama, llama.cpp and vLLM. I got them all to work with Intel GPUs, but vLLM was configurable and had sane explanations for using multiple GPUs with tensor parallelism. It also has a built-in OpenAI-compatible API server, which is a big plus if you plan on developing services that use the OpenAI API.
Let’s dissect the key features of the deployment manifest. It’s been redacted for showcase purposes, but you can find the full file in the repo link below:
➡️ Exact file in repo: deployments/vllm/vllm-14b-tp2/vllm-14b-tp2.yaml
# ==============================================================================
# vLLM 14B Model Deployment - Blog Showcase Version
# ==============================================================================
# This deployment demonstrates four key Kubernetes patterns:
# 1. KitOps sidecar for model artifact management
# 2. Dynamic Resource Allocation for GPU claims
# 3. Persistent Volume Claims for model storage
# 4. vLLM configuration for tensor parallel inference
# ==============================================================================

apiVersion: apps/v1
kind: Deployment
metadata:
  name: vllm-14b-tp2
  namespace: vllm
spec:
  replicas: 1
  selector:
    matchLabels: { app.kubernetes.io/name: vllm-14b-tp2 }
  template:
    metadata:
      labels: { app.kubernetes.io/name: vllm-14b-tp2 }
    spec:
      nodeSelector:
        kubernetes.io/hostname: sonda-core

      # =======================================================================
      # =======================================================================
      # 🎯 KEY FEATURE #1: Dynamic Resource Allocation for GPU Claims
      # =======================================================================
      # Uses Kubernetes 1.30+ DRA to claim multiple GPUs for tensor parallelism
      resourceClaims:
        - name: intel-gpu-resource
          resourceClaimTemplateName: dual-gpu-claim  # Claims 2x Intel GPUs

      # =======================================================================
      # 🎯 KEY FEATURE #2: Persistent Volume Claims for Model Storage
      # =======================================================================
      volumes:
      - name: modelkit
        persistentVolumeClaim:
          claimName: vllm-modelkits  # Shared storage across vLLM instances (see PVC manifest: https://github.com/sonda-red/cluster-management/blob/main/deployments/vllm/pvc.yaml)
      - name: dshm
        emptyDir: { medium: Memory, sizeLimit: 16Gi }  # Shared memory for tensor parallel

      # =======================================================================
      # 🎯 KEY FEATURE #3: KitOps Sidecar for Model Artifact Management
      # =======================================================================
      initContainers:
      - name: kitops-init
        image: ghcr.io/kitops-ml/kitops-init:v1.7.0
        env:
        - name: MODELKIT_REF
          value: "harbor.harbor/sonda-red/ds-r1-qwen-14b:0.0.1"  # Model artifact in registry
        - name: UNPACK_PATH
          value: /data/ds-r1-qwen-14b  # Where to extract model files
        - name: UNPACK_FILTER
          value: model  # Only extract model weights, not datasets
        - name: EXTRA_FLAGS
          value: "--tls-verify=false --plain-http -vv"  # Registry connection flags
        volumeMounts:
        - { name: modelkit, mountPath: /data/ds-r1-qwen-14b }

      # =======================================================================
      # 🎯 KEY FEATURE #4: vLLM Configuration for Tensor Parallel Inference
      # =======================================================================
      containers:
      - name: vllm
        image: intelanalytics/ipex-llm-serving-xpu:0.8.3-b20
        command: ["/bin/bash","-lc"]
        args:
          - |
            python -m ipex_llm.vllm.xpu.entrypoints.openai.api_server \
              --served-model-name ds-r1-qwen-14b \
              --port 8014 \
              --model /data/ds-r1-qwen-14b \
              --device xpu \
              --tensor-parallel-size 2 \        # Split across 2 GPUs
              --gpu-memory-utilization 0.85 \   # Use 85% of GPU memory
              --load-in-low-bit sym_int8 \      # 8-bit quantization
              --max-model-len 2048 \             # Context window
              --max-num-seqs 12                  # Concurrent sequences

        # Essential environment variables for Intel XPU multi-GPU setup
        env:
          - { name: ZE_AFFINITY_MASK, value: "0,1" }              # Use GPU 0 and 1
          - { name: ONEAPI_DEVICE_SELECTOR, value: "level_zero:gpu" }
          - { name: CCL_ATL_TRANSPORT, value: "ofi" }             # Multi-GPU communication

        ports: [{ containerPort: 8014 }]

        volumeMounts:
          - { name: modelkit, mountPath: /data/ds-r1-qwen-14b }   # Model files from PVC
          - { name: dshm, mountPath: /dev/shm }                   # Shared memory

        resources:
          requests: { cpu: "8", memory: "28Gi" }
          limits: { cpu: "16", memory: "36Gi" }
          claims:
            - name: intel-gpu-resource  # Claim the GPUs from DRA

        # Health checks optimized for LLM startup time
        startupProbe:
          tcpSocket: { port: 8014 }
          periodSeconds: 10
          failureThreshold: 120  # Allow 20 minutes for model loading

---
# ==============================================================================
# Service: Expose vLLM API with OpenAI-compatible endpoints
# ==============================================================================
apiVersion: v1
kind: Service
metadata:
  name: vllm-14b-tp2
  namespace: vllm
spec:
  selector: { app.kubernetes.io/name: vllm-14b-tp2 }
  ports: [{ name: http, port: 8014, targetPort: 8014 }]
  type: ClusterIP
Challenges Link to heading
Graceful shutdowns Link to heading
The most impactful issue I hit was related to vLLM’s handling of shutdown signals. When Kubernetes decides to terminate a pod (for example, during scaling down or rolling updates), it sends a SIGTERM signal to the main container process. vLLM needs to handle this signal gracefully to ensure that ongoing requests are completed and resources are freed properly.
In the future, I’ll need to explore this further and write a custom lifecycle handler if needed. For now, I set a long terminationGracePeriodSeconds to give vLLM enough time to shut down properly. I see this topic is still actively discussed in the vLLM community, so hopefully it will improve in future releases.
… The goal is that when vLLM shuts down - whether intentionally or due to an internal failure - the cause of shutdown should be logged with a useful level of detail, and the server’s resources (especially GPU memory) should be freed. …
05 Monitoring and Observability Link to heading
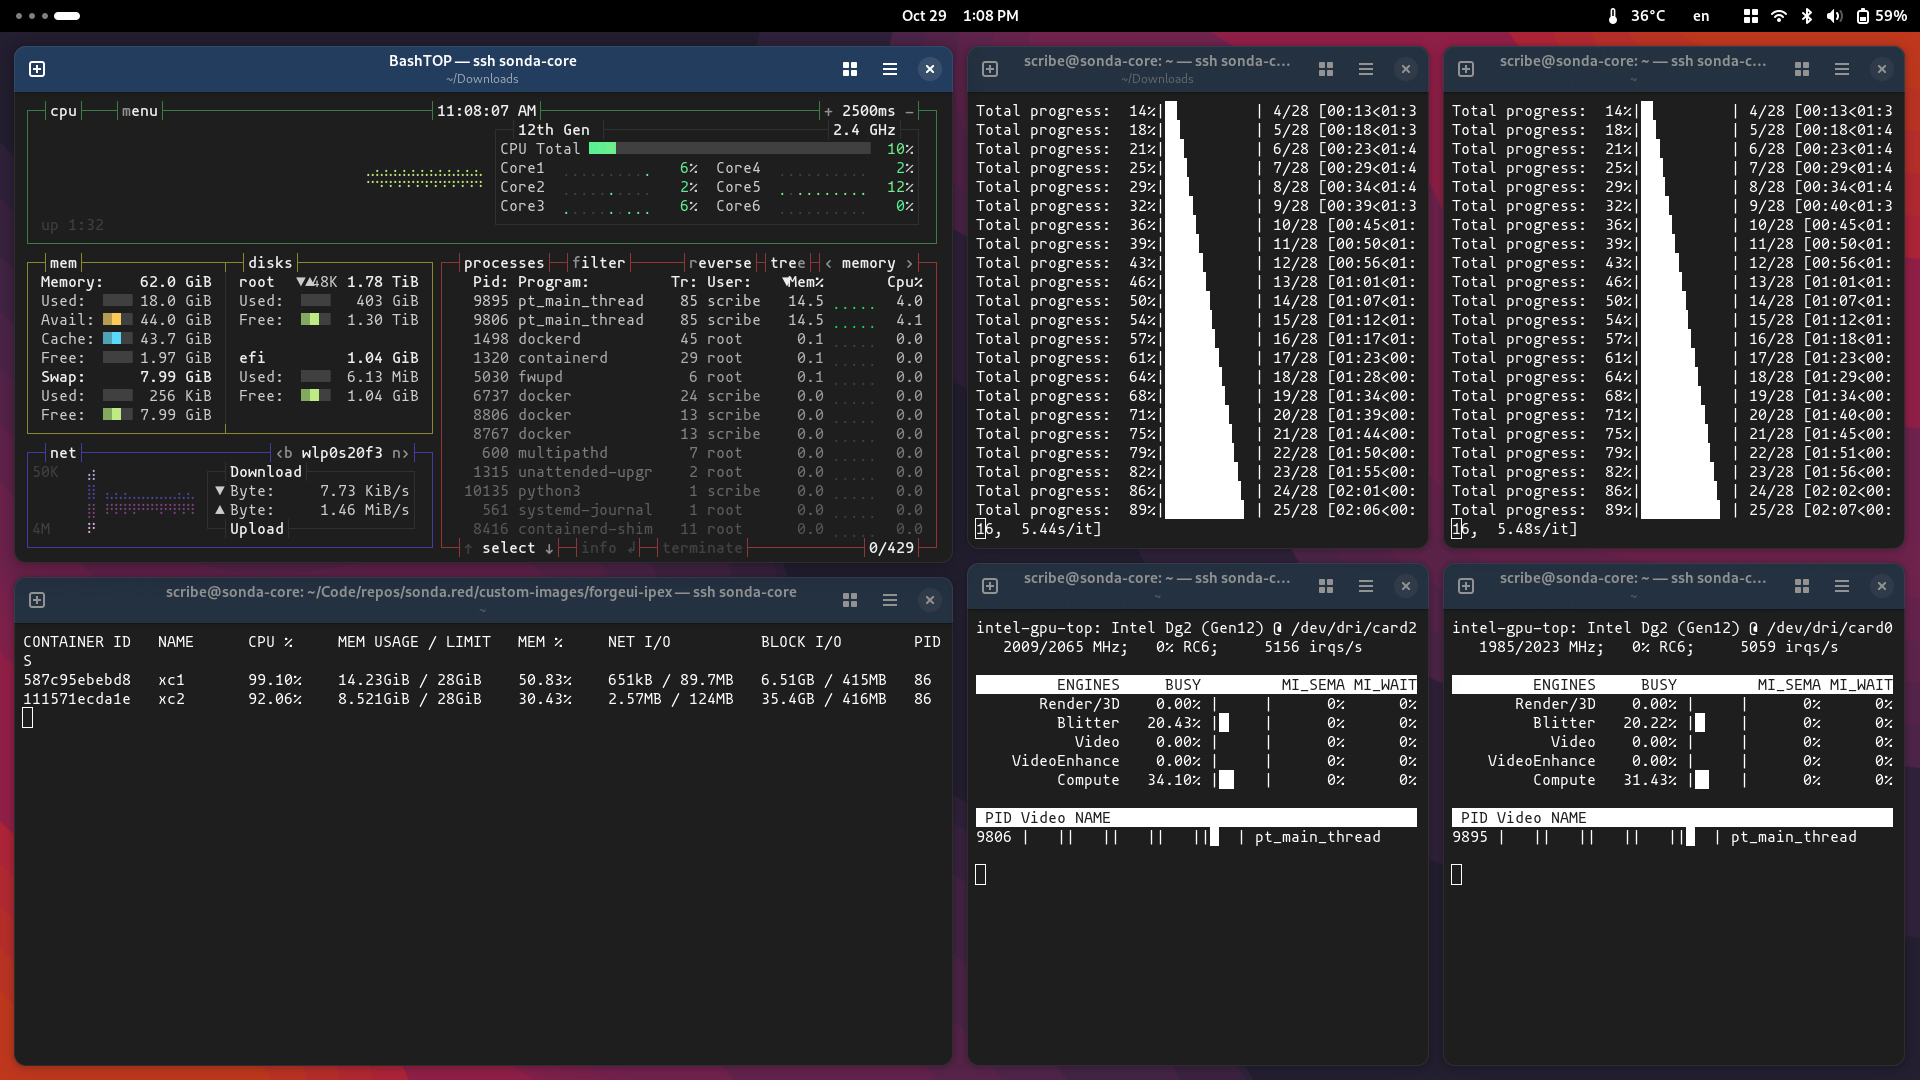
In my LinkedIn promo about the previous post I shared a screenshot of how I used to monitor my two A770 GPUs with intel_gpu_top, docker stats and bashtop in terminal windows side by side. It was clunky and not a solution for Kubernetes.
Aim Link to heading
- See real GPU load and memory.
- See inference throughput and latency next to logs.
Stack Link to heading
- Prometheus and Grafana with kube-prometheus-stack
- xpumanager
Actions I took Link to heading
- Deployed kube-prometheus-stack with Helm.
- Set up a monitoring DRA ResourceClaim for xpumanager that doesn’t make GPUs unavailable to workloads.
- Deployed xpumanager as a DaemonSet with nodeSelector.
- Configured service and ServiceMonitor for xpumanager and vLLM.
- Created Grafana dashboards for the
xpum_metrics
Intel’s solution for monitoring Arc GPUs and Gaudi accelerators is called xpumanager. It exposes GPU metrics over HTTP in a Prometheus-compatible format. I deployed it as a DaemonSet, but it’s only on the GPU node. It’s ServiceMonitor scrapes the /metrics endpoint and Prometheus stores the data. I then built a Grafana dashboard to visualize GPU metrics alongside inference throughput and latency from vLLM logs (dashboard JSON).
| XPU metrics Dashboard | vLLM metrics Dashboard |
|---|---|
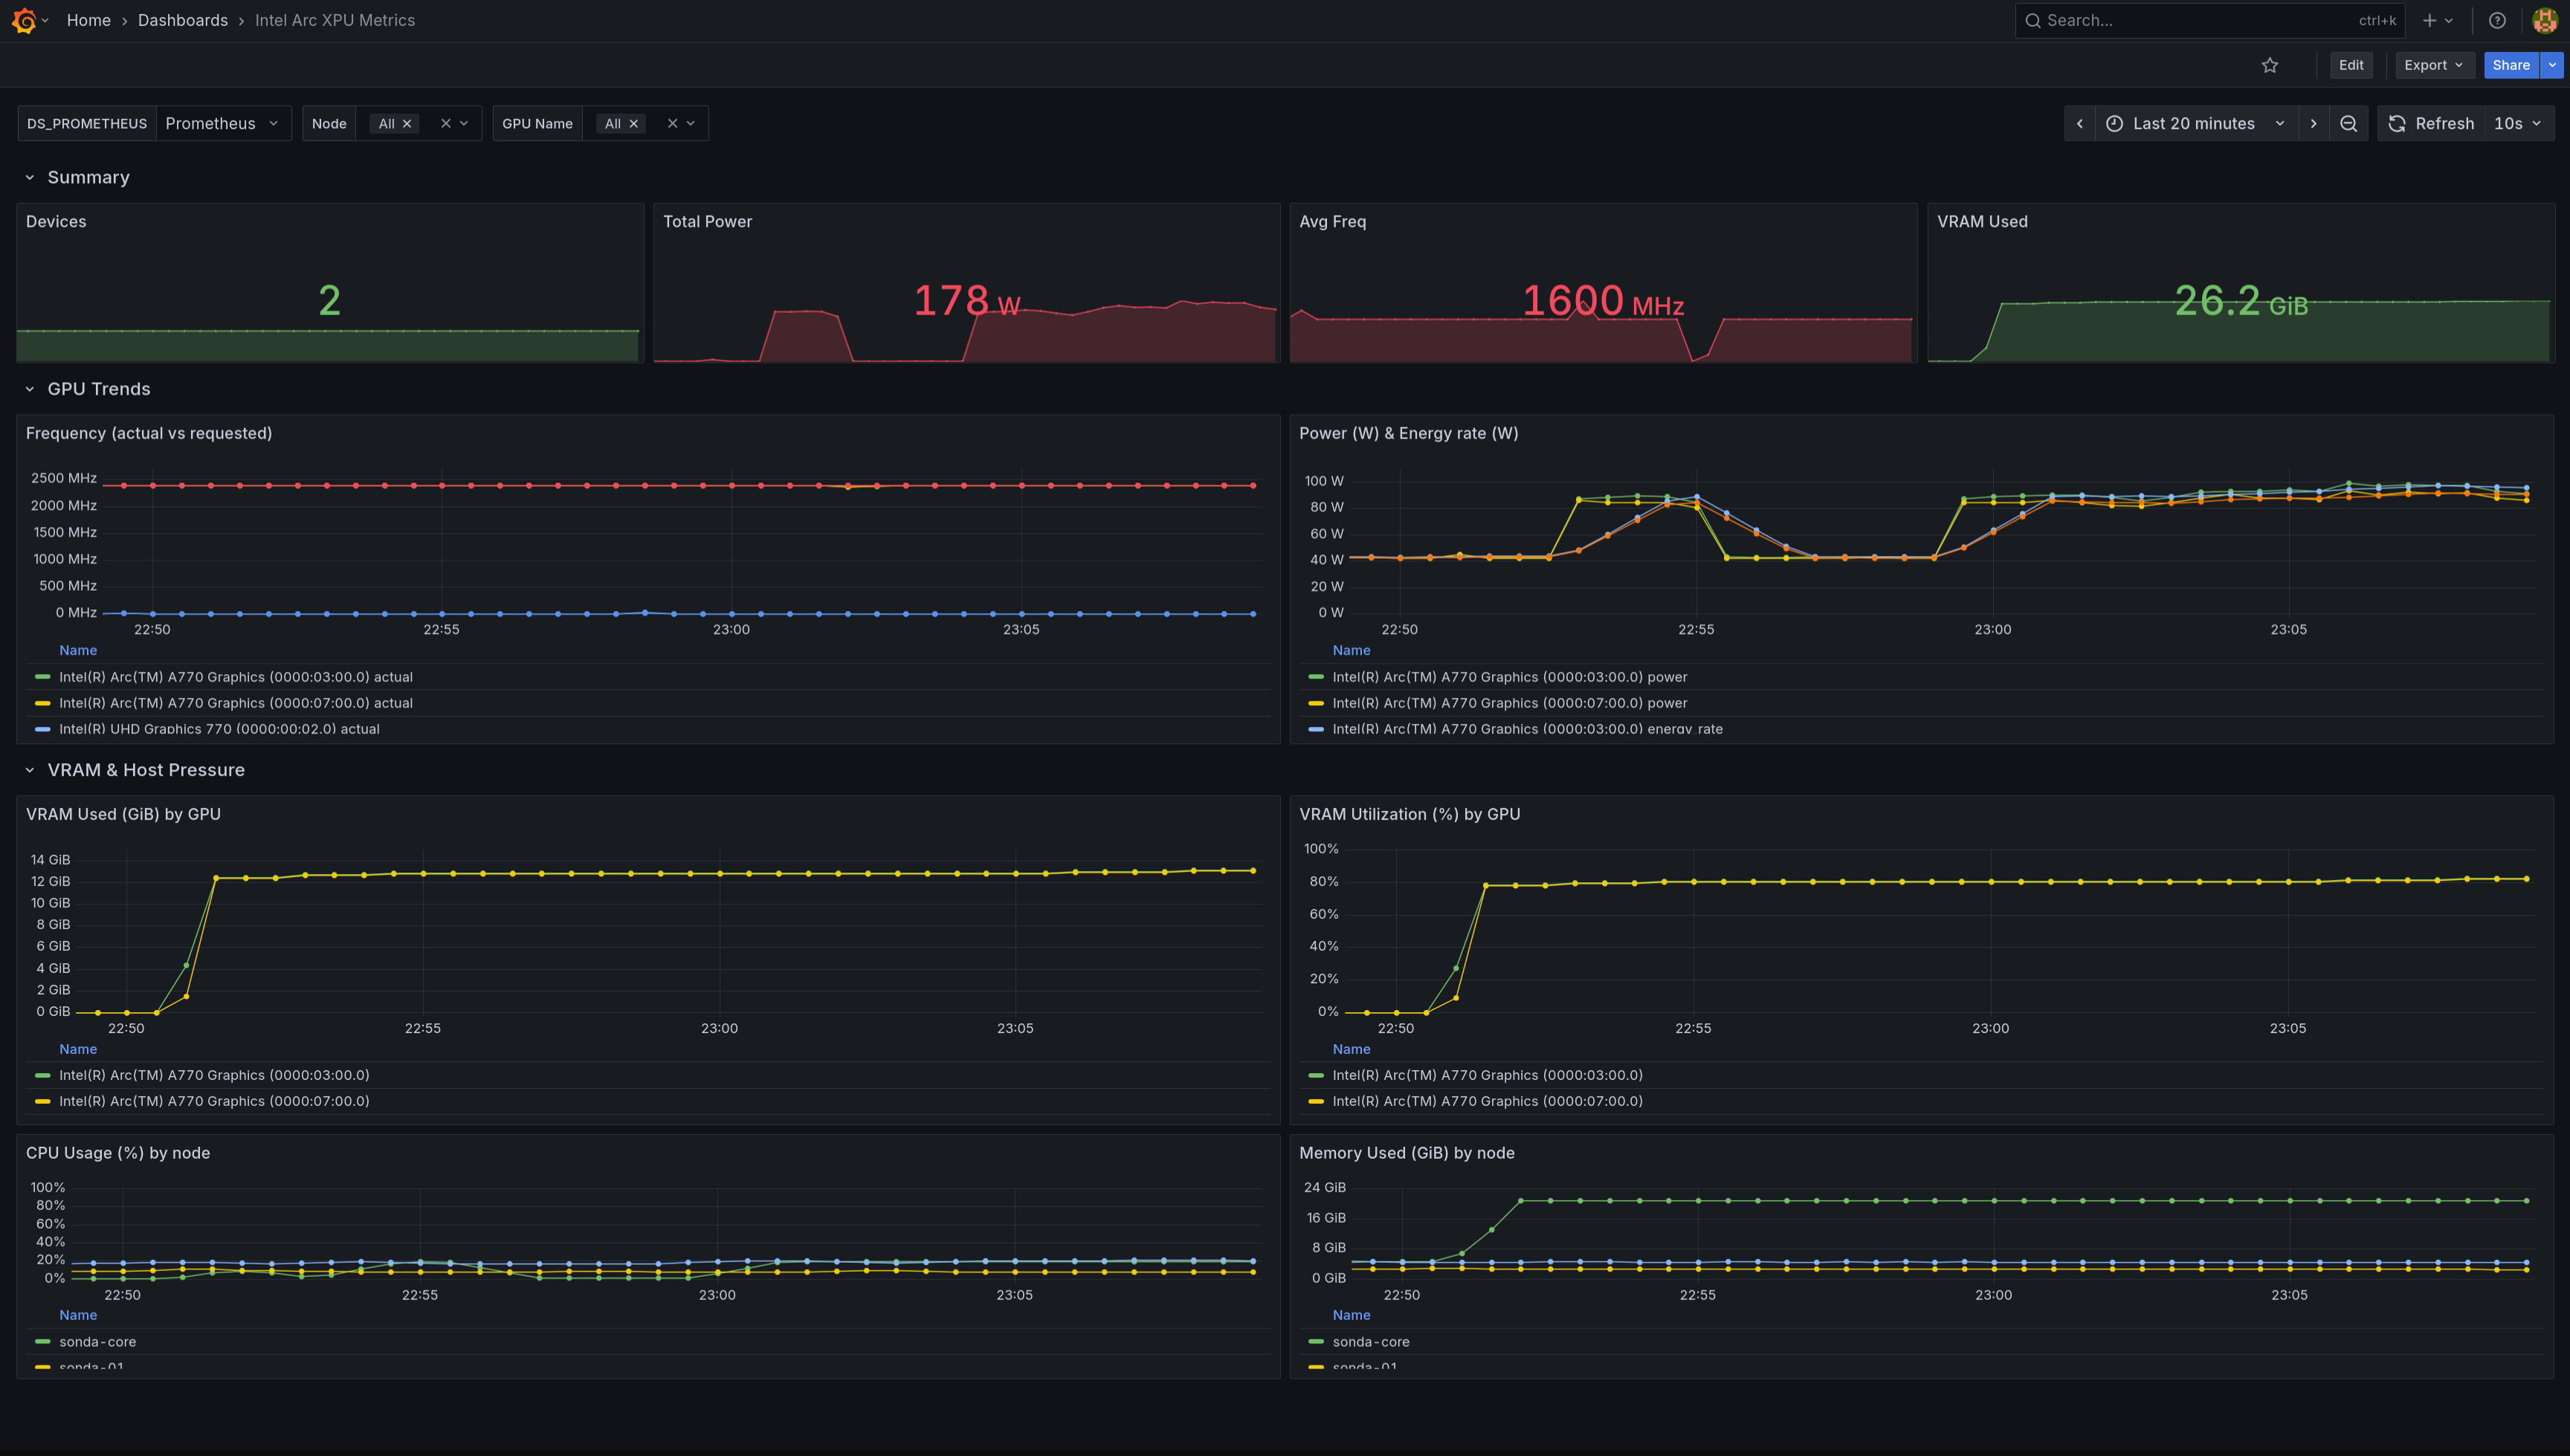 |
 |
Challenges Link to heading
xpumanager Link to heading
I’m really trying to keep a neutral tone here, but the way xpumanager is handled in the repos is atrocious. When you go to the official repo of the Intel resource driver and follow the deployment instructions for deploying xpumanager, you hit a few issues:
- The monitoring ResourceClaimTemplate uses
v1beta1in the latest release of the Intel resource drivers. So I need to use my own manifests instead of using the ones from the repo. - xpumanager manifest uses outdated images that need dependency fixes and prevent startup of the monitor service. The issue is still not closed and I’m using the workaround found in the issue comments.
- The
/metricsendpoint sometimes returns HTML instead of Prometheus text.
time=2025-08-31T19:02:04.889Z level=ERROR source=scrape.go:1631 msg="Failed to determine correct type of scrape target." component="scrape manager" scrape_pool=intel-xpumanager target=http://intel-xpumanager.intel.svc:29999/metrics content_type="text/html; charset=utf-8" fallback_media_type="" err="received unsupported Content-Type \"text/html; charset=utf-8\" and no fallback_scrape_protocol specified for target"
That error means Prometheus is hitting the xpumanager service but instead of getting plain text metrics it’s getting an HTML page.
Prometheus only accepts text/plain; version=0.0.4 (the Prometheus exposition format) or OpenMetrics (application/openmetrics-text). If the response is text/html, Prometheus assumes it’s a web page, not metrics. I needed to reconfigure Prometheus to handle this case.
- The Grafana dashboard available in the xpumanager repo is not adapted to Arc GPUs and shows no data for most of its panels. I had to build my own dashboard from scratch (dashboard JSON).
- Intel Arc A770 doesn’t expose all the metrics that xpumanager can collect. For example, temperature is not available on Arc GPUs, so any panel showing temp data will be empty.
Conclusion Link to heading
This milestone has made the effort of building an Intel Arc GPU based LLM inference stack worthwhile. There were moments when I nearly gave up. I even put the cards up for sale out of frustration, but there were no buyers. That left me more or less forced to make them work. Every time I considered switching to NVIDIA though, the high prices and the reminder that this was meant to be a learning exercise, not a production grade investment, kept me back.
Now it feels like the fun is just beginning. The plumbing is largely in place: model packaging, GPU allocation, and observability are solved enough to let me shift my focus upward. I can finally spend more time at the application layer and start building useful services on top of the stack, instead of wrestling with infrastructure basics.
The timing also feels right. With Nvidia buying a $5 billion stake in Intel and the two companies announcing a strategic chip design partnership, my bet on Intel hardware looks a little less lonely. I am also keeping an eye on the upcoming Intel Arc Pro B60 series. If the single or dual chip models land well, I might add one to the mix for more GPU power.
The next step is to see what meaningful applications can be built on top of this foundation.